Monitoring Services using the Service Telemetry Page
This topic describes how to view service logs and usage reports for a Port, MCR, MVE, VXC, NAT Gateway, and IX in the Portal. These detailed reports help you monitor connections, evaluate performance, and troubleshoot issues with your Megaport services.
Viewing Service Telemetry
The Service Telemetry page provides a multi-service landing page that displays the status of all your services in one place. You can filter the services by type, status, and location. You can also view the details of a specific service searching for it by name, location, or service ID.
Tip
To search for multiple services at once, separate your search terms with commas. For example, enter Sydney, Melbourne, VXC. A service appears if it matches any of the terms. Search terms are not case-sensitive and can match part of a service name, location, or service ID. Terms can contain spaces, so you can search for locations with multiple words.
To view Service Telemetry
-
Log in to the Megaport Portal and choose Monitoring & Diagnostics > Service Telemetry.
The Service Telemetry page appears, showing graphs for Ports, MCRs, MVEs, VXCs, NAT Gateways, and IX connections.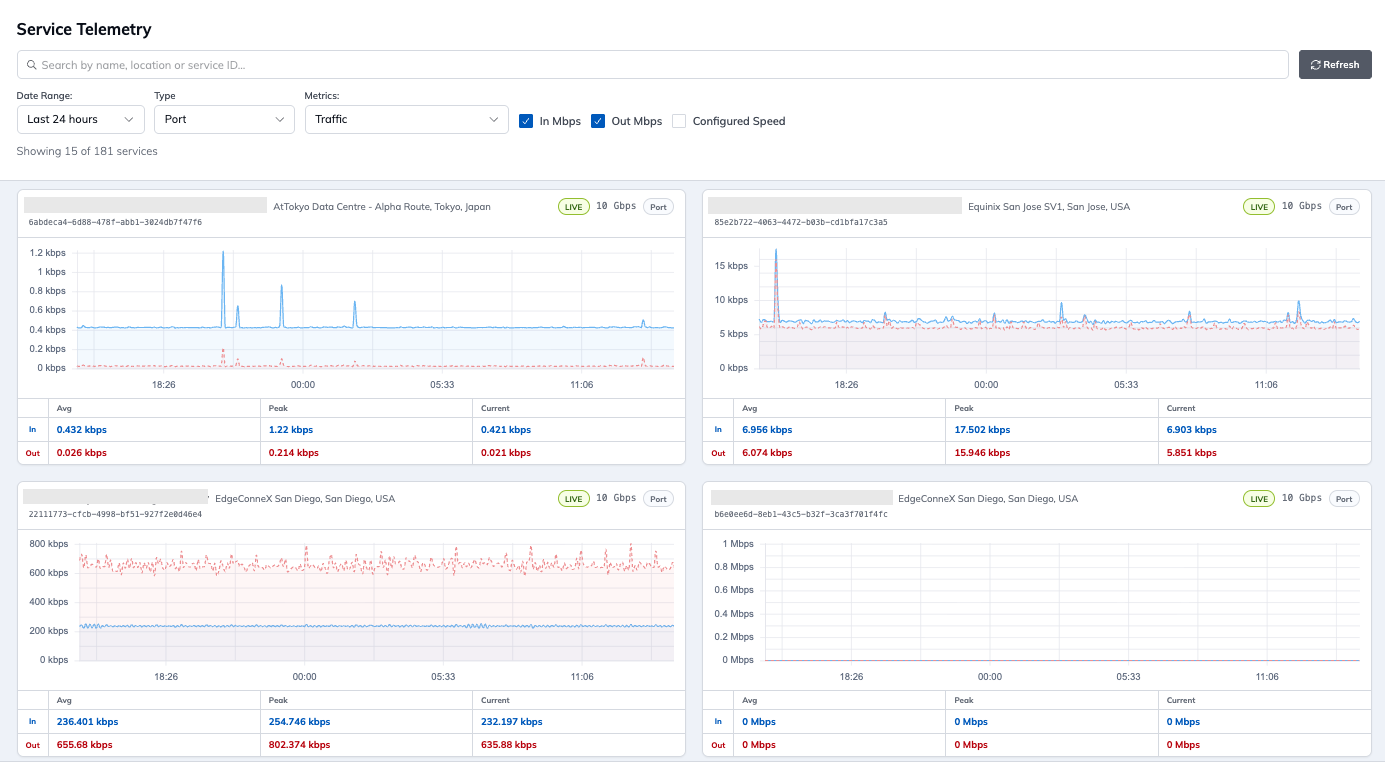
-
In the Date Range field, enter the range of dates for which to view usage details. You can enter the date range manually using the date picker or select from the following options:
- Last hour
- Last 12 hours
- Last 24 hours
- Last week
- Last month
- Last 3 months
- Last 6 months
- Last 12 months
- Custom - Enter a custom date range using the date picker.
The default time range is the last 24 hours.
-
From the Type drop-down list, select the service type.
Note
For a VXC connection, you can view graphs from the A-End or B-End perspective. By default, the VXC graph displays the in and out details from the perspective of the end you are viewing. Select the A-End (the Port) or B-End (the destination) of the VXC from the graph heading drop-down list.
-
In the Metrics drop-down list, select a metric for which to view usage details.
The available metrics depend on the selected service type. You can view a graph for one metric at a time.Note
The metrics available for selection vary by service type. For example, Port provide more metrics than VXCs, and Routes Imported, Routes Filtered, Broadcast/Multicast, and Unknown Unicast are available only for IX connections.
Metric Description Traffic In Mbps - Number of inbound Megabits per second.
Out Mbps - Number of outbound Megabits per second.
Configured Speed Mbps - Configured speed of the Port, in Megabits per second.Packets In pps - Incoming packet rate to the Port, measured in packets per second
Out pps - Outbound packet rate from the Port, measured in packets per second.Errors Errors/second - Rate of incoming and outgoing errors, measured in errors per second. Optical Optical signal levels for the Port, measured in decibel milliwatts. This metric is useful for measuring any signal loss over the connection.
Tx Power dBm - Light level transmitted.
Rx Power dBm - Light level received.
For a 100 Gbps Port, optical light levels are reported per lane. When you select the Optical metric, the graph displays a separate line for each lane, Tx Lane 1 through Tx Lane 4 and Rx Lane 1 through Rx Lane 4, instead of a single Tx Power and Rx Power pair.
For a Port with more than one interface, such as a Link Aggregation Group (LAG), the graph displays optical light levels for all of its interfaces.Subscribed Speed Configured speed of the service, in Megabits per second. Service Count The number of active services connected to this service. Routes Imported A count of the BGP routes accepted from the IX peer, shown separately for each route server (primary and secondary, IPv4 and IPv6). Routes Filtered A count of the imported BGP routes dropped by Megaport route filters, shown separately for each route server (primary and secondary, IPv4 and IPv6). Broadcast/Multicast Traffic The volume of broadcast and multicast traffic emitted from the IX peer. A low level is expected. A high level can indicate a problem with the peer’s configuration.
For more information, see IX Requirements.Broadcast/Multicast Packets The rate of broadcast and multicast packets emitted from the IX peer. Unknown Unicast Traffic The volume of unknown unicast traffic emitted from the IX peer. Persistent unknown unicast traffic can indicate the peer is sending traffic to another peer on the IX that is no longer present. Unknown Unicast Packets The rate of unknown unicast packets emitted from the IX peer. -
In the Resolution field, select the level of detail for the graph: 5 min, Daily, or Monthly.
Note
- 5 min resolution is available only for ranges of 3 months or less.
- Daily resolution is available for any range.
- Monthly resolution is available only for ranges greater than 3 months.
For Daily or Monthly resolution, select one or more of Average, Peak, 95th percentile, and Minimum to plot those values on the graph. The Aggregate field is not shown for 5 min resolution.
You can customize the graph by selecting or clearing the check boxes for In Mbps, Out Mbps, and Configured Speed to show or hide data.
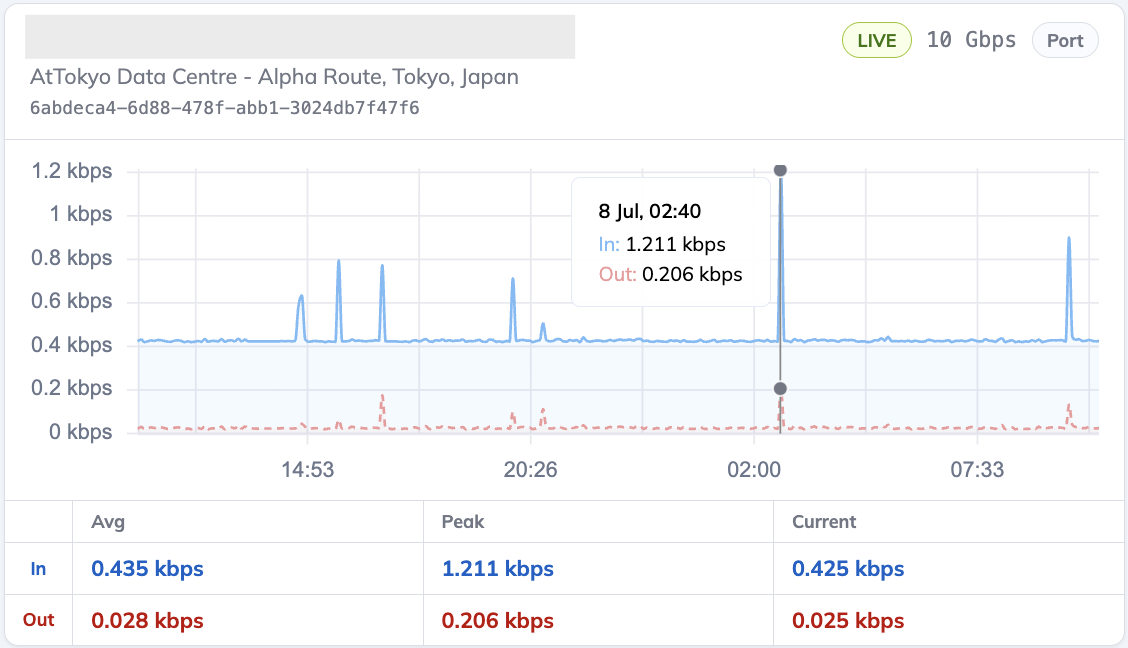
Use the mouse to hover over a specific data point to see the values and exact timestamp.
Tip
- To export the telemetry data to CSV, select Export CSV. The exported data uses the resolution you selected.
- To view a graph in a larger size, click the Expand graph icon at the top right of the graph. The graph opens in a larger size for better readability. To return to the Service Telemetry page, click close.