Monitoring Ports, VXCs, Megaport Internet, and IXs
This topic describes how to view service logs and usage reports for a Port, Virtual Cross Connect (VXC), Megaport Internet connection, and IX in the Megaport Portal. These detailed logs and reports help you monitor connections, evaluate performance, and troubleshoot issues with your Megaport services.
For information about monitoring maintenance and outage events that affect your services, including current, scheduled, and past events, see Monitoring Maintenance and Outage Events.
Megaport offers a public API that you can use to access the services available through the service logs and usage reports. To view the API documentation, see dev.megaport.com. For information about API monitoring, see Monitoring Service Status with the API and Setting up OpenMetrics for Service Monitoring.
Viewing service logs
Viewing the Service Logs is a simple way to monitor the activity and performance of your Megaport services. For example, you can view the status of a Port or if a BGP session is down on a VXC.
Megaport starts reporting metrics as soon as the service is live in the Megaport Portal. A Port’s Billing graph starts reporting metrics either when it goes live, or 14 days after it is configured. For more information about billing and Port contracts, see Port Pricing and Contract Terms.
To view service logs for a Port
- Log in to the Megaport Portal and choose Services.
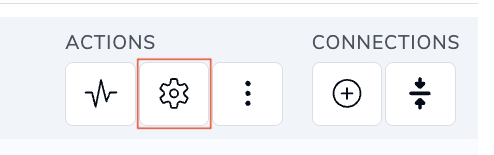
- Click the gear icon next to the Port.
- On the Port Details page, click Logs.
The Service Logs page appears.
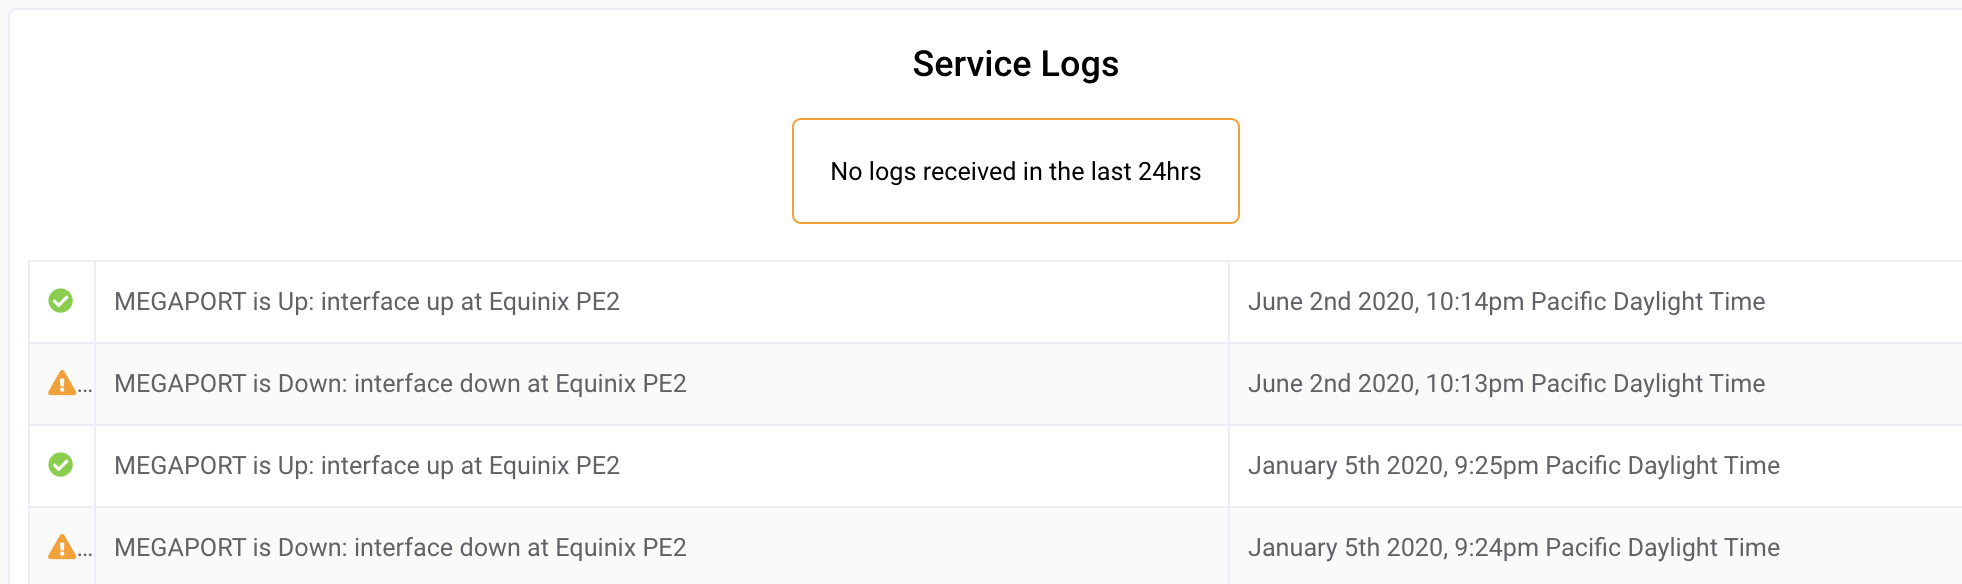
The 100 most recent events are displayed. A green check mark indicates that the service is running. A yellow warning icon indicates that there is a potential issue with the service.
Note
Company Admins see an additional Activity Logs tab next to Service Logs. The Activity Logs tab displays user activity for the Port, such as configuration changes and other administrative actions. For more information about activity logs, see Viewing Activity Logs.
Tip
For more information about investigating issues, see Troubleshooting.
To view service logs for a connection
- Log in to the Megaport Portal and choose Services.
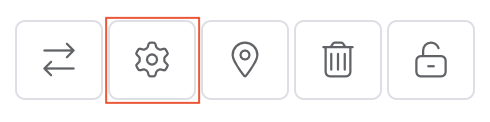
- Click the gear icon next to the VXC, Megaport Internet connection, or IX.
- On the Connection Details page, click Logs.
The Service Logs page appears. The most recent log events are listed first.
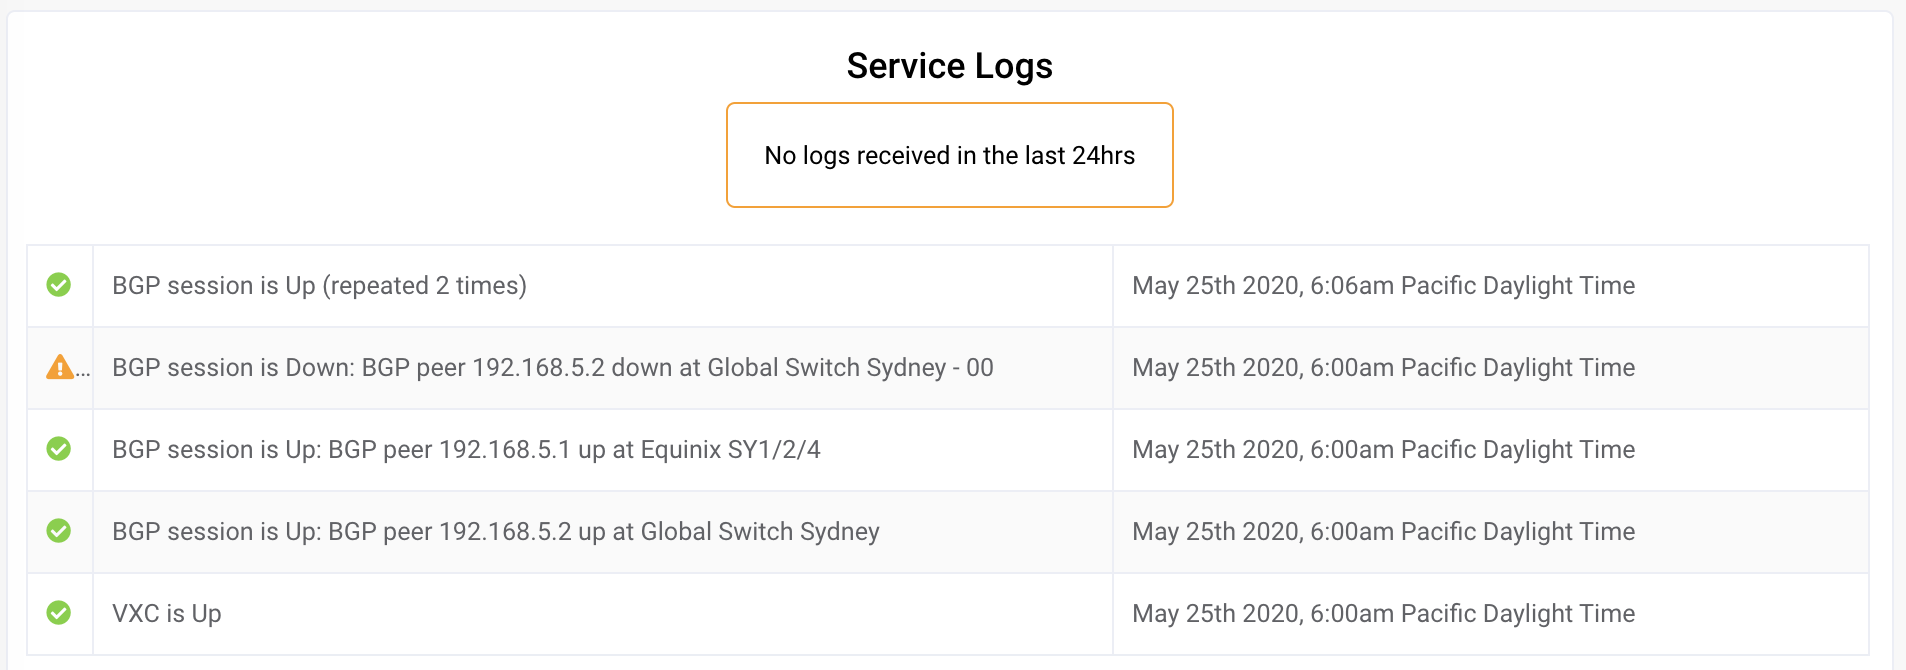
The 100 most recent events are displayed. A green check mark indicates that the service is running as expected, or shows a non-critical event such as a change in speed. A yellow warning icon indicates that there is an event that requires attention.
Note
Company Admins see an additional Activity Logs tab next to Service Logs. The Activity Logs tab displays user activity for the connection, such as configuration changes and other administrative actions. For more information about activity logs, see Viewing Activity Logs.
Tip
For more information about investigating issues, see Troubleshooting.
Viewing usage details
You can access a Service Graph to view usage details for a Port, VXC, or Megaport Internet connection. The Service Graph provides a visual representation of the service usage over time. You can view the graph for a specific date range and select a metric to display.
The Service Graph provides helpful information such as errors, optical signal levels, inbound/outbound packets, and inbound and outbound traffic. The graph is useful for comparing monthly usage on a Port or connection. You can export the service usage data in comma-separated values (CSV) format for analysis in spreadsheets and databases.
You can access a Service Graph from these locations:
-
From the Services page, click the gear icon, then select Usage. You will see a Service Graph for the selected service only.
-
From Tools > Service Telemetry. This page shows usage for multiple services. You can filter the information for a specified date range and select a metric to display. For more information, see Monitoring Services using the Service Telemetry Page.
Note
The Service Graph is updated every 5 minutes.
To view usage details for a Port on the Services page
- Log in to the Megaport Portal and choose Services.
- Click the gear icon next to the Port.
-
On the Port Details page, click Usage.
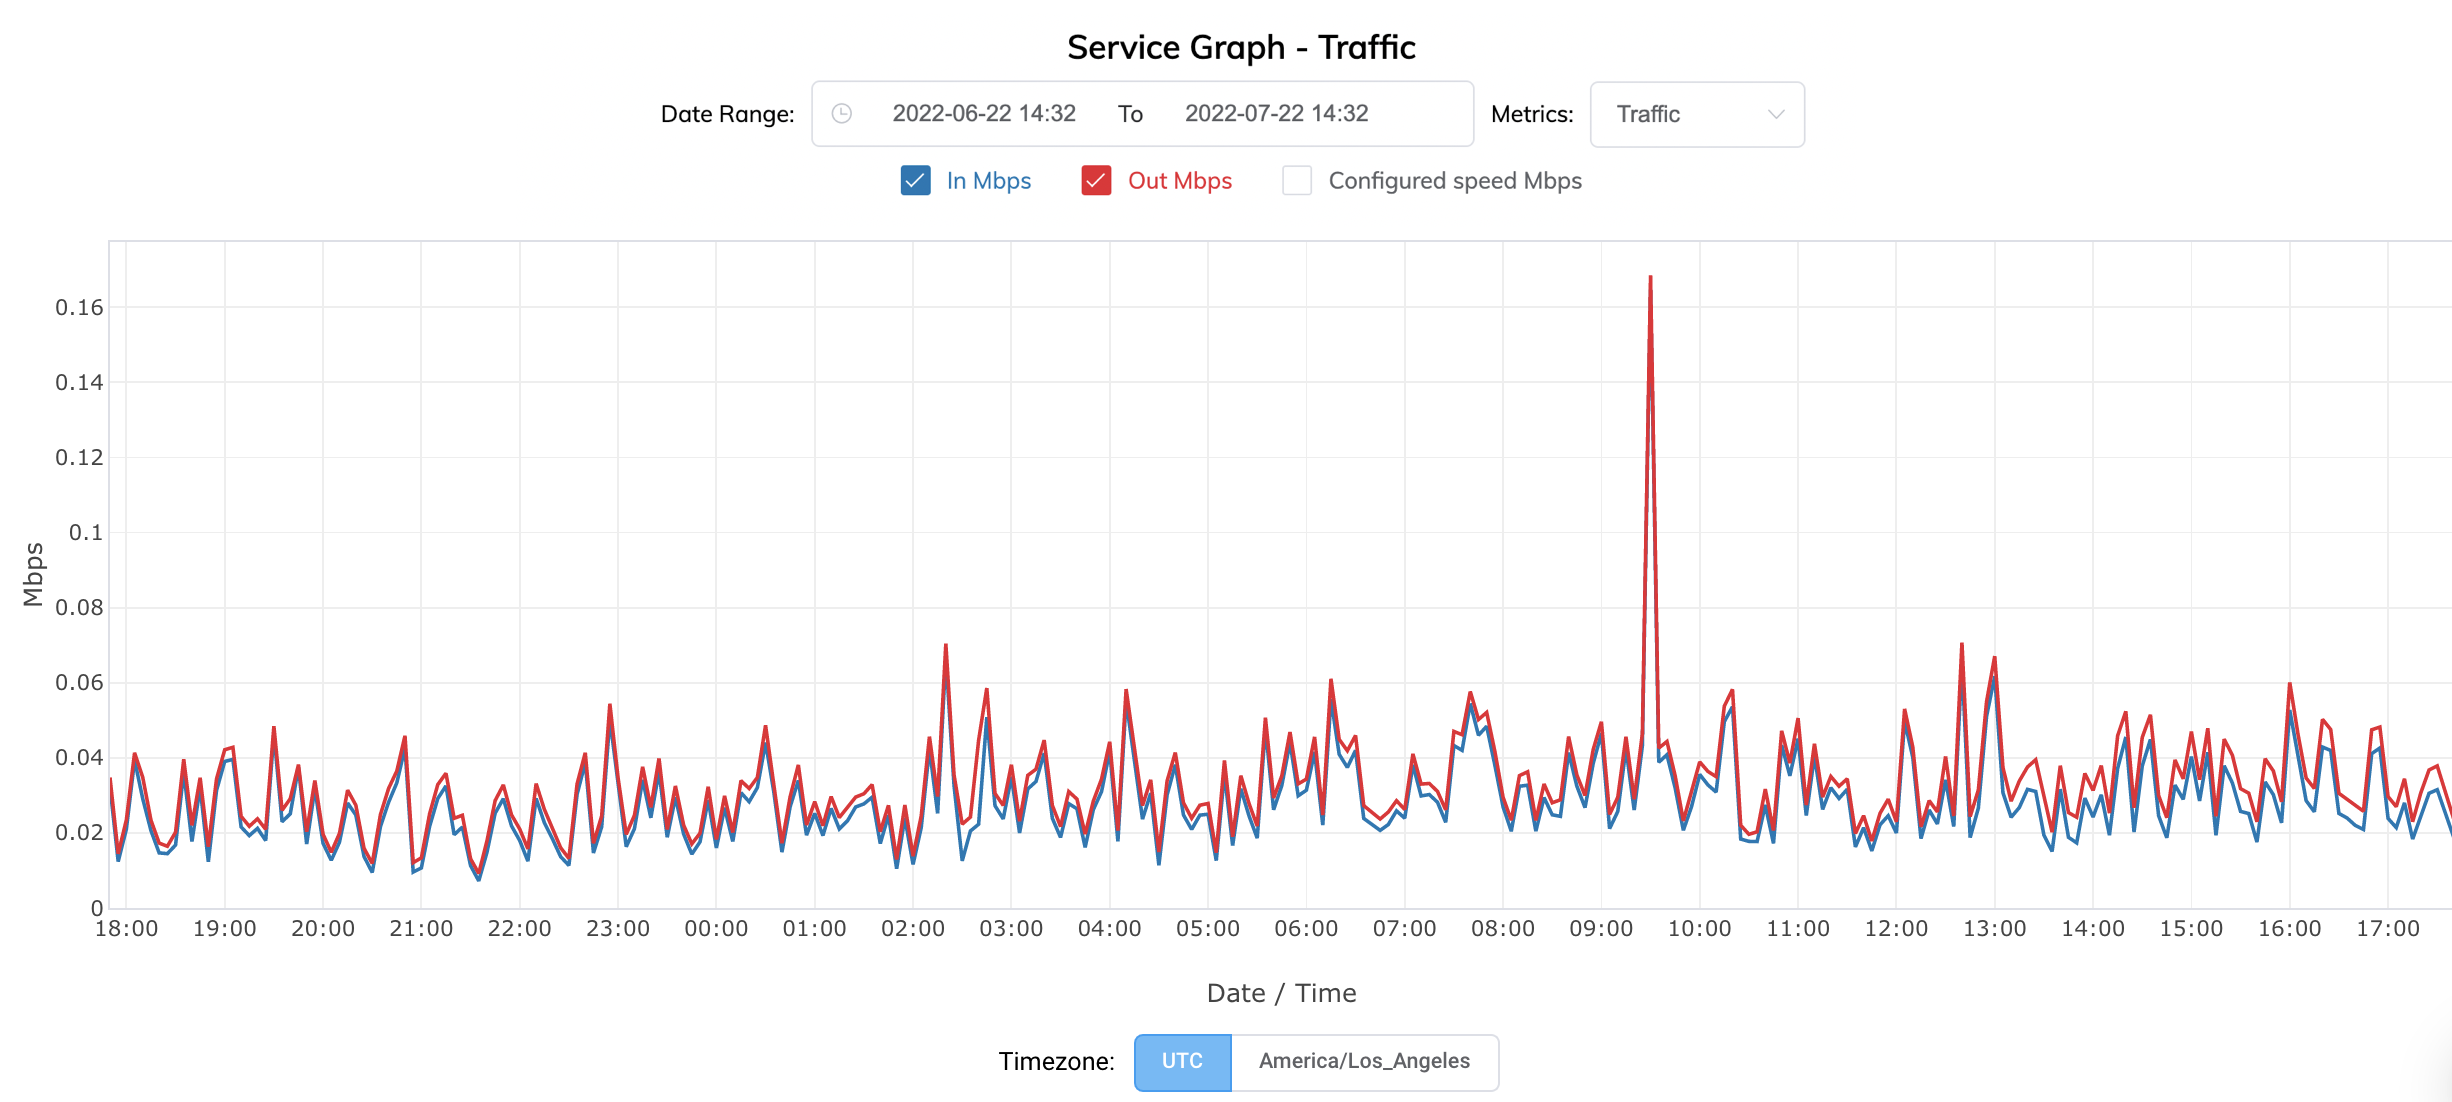
The Service Graph page appears, showing traffic by default.
-
In the Date Range field, enter the range of dates for which to view usage details. You can enter the date range manually using the date picker or select from the following options:
- Last hour
- Last 12 hours
- Last 24 hours
- Last week
- Last month
- Last 3 months
The default time range is the last 24 hours.
-
In the Metrics drop-down list, select a metric for which to view usage details.
You can view a graph for one metric at a time.Metric Description Errors Errors/second - Rate of incoming and outgoing errors, measured in errors per second. Optical Optical signal levels for the Port, measured in decibel milliwatts. This metric is useful for measuring any signal loss over the connection.
Tx Power dBm - Light level transmitted.
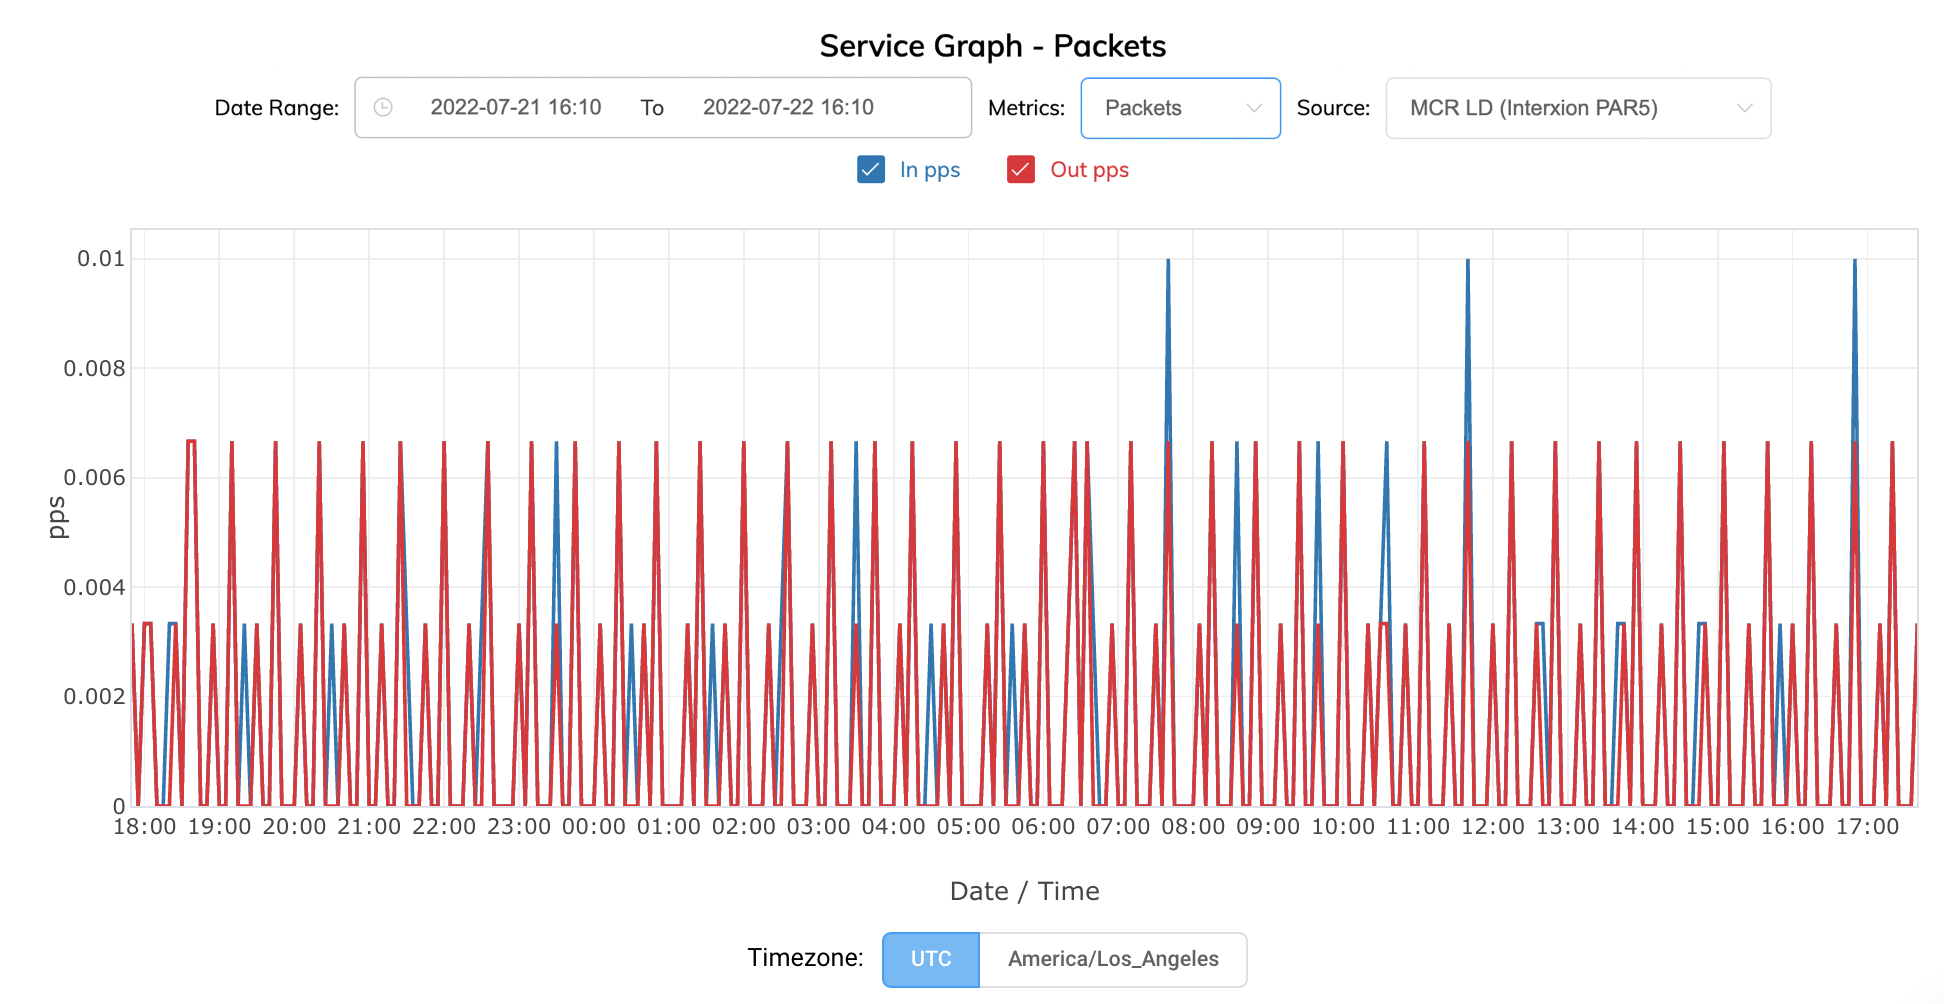
Rx Power dBm - Light level received.Packets In pps - Incoming packet rate to the Port, measured in packets per second
Out pps - Outbound packet rate from the Port, measured in packets per second.Traffic In Mbps - Number of inbound Megabits per second.
Out Mbps - Number of outbound Megabits per second.
Configured Speed Mbps - Configured speed of the Port, in Megabits per second.You can customize the graph by selecting or clearing the check boxes for In Mbps, Out Mbps, and Configured Speed to show or hide data.
Use the mouse to hover over a specific data point to see the values and exact timestamp.
You can zoom to a particular area of the graph if you place the mouse pointer over the graph, and then click and hold the left mouse button. Move the mouse left or right and release the left mouse button to zoom in. To return to the default view, double-click the graph. -
Click Export CSV to download the displayed Port usage data in CSV format.
You can use the CSV file to import the data into spreadsheets and databases. You can open the CSV file in any text editor. -
Click UTC or your local time zone to change the time zone.
To view usage details for a connection
- Log in to the Megaport Portal and choose Services.
- Click the gear icon next to the VXC, Megaport Internet connection.
-
On the Connection Details page, click Usage.
The Service Graph page appears.
-
In the Date Range field, enter the range of dates for which to view usage details. You can enter the date range manually using the date picker or select from the following options:
- Last hour
- Last 12 hours
- Last 24 hours
- Last week
- Last month
- Last 3 months
The default time range is the last 24 hours.
-
In the Metrics drop-down list, select a metric for which to view usage details.
You can view a graph for one metric at a time.Metric Description Errors Errors/second - Rate of incoming and outgoing errors, measured in errors per second. Optical Optical signal levels for the Port, measured in decibel milliwatts. This metric is useful for measuring any signal loss over the connection.
Tx Power dBm - Light level transmitted.
Rx Power dBm - Light level received.Packets In pps - Incoming packet rate to the Port, measured in packets per second
Out pps - Outbound packet rate from the Port, measured in packets per second.Traffic In Mbps - Number of inbound Megabits per second.
Out Mbps - Number of outbound Megabits per second.
Configured Speed Mbps - Configured speed of the Port, in Megabits per second.You can customize the graph by selecting or clearing the check boxes for In Mbps, Out Mbps, and Configured Speed to show or hide data.
Use the mouse to hover over a specific data point to see the values and exact timestamp.
You can zoom to a particular area of the graph if you place the mouse pointer over the graph, and then click and hold the left mouse button. Move the mouse left or right and release the left mouse button to zoom in. To return to the default view, double-click the graph. -
Click Export CSV to download the displayed connection usage data in CSV format. You can use the CSV file to import the data into spreadsheets and databases. You can open the CSV file in any text editor.
- Click UTC or your local time zone to change the time zone.
-
For VXCs, select the A-End (the Port) or B-End (the destination) of the VXC from the Source drop-down list.
On a VXC, you can view graphs from the A-End or B-End perspective. By default, the VXC graph displays the in and out details from the perspective of the end you are viewing. In an Internet Exchange graph you are simply connecting to that IX, so you can only view graphs for the A-End. Similar to IX, in a Megaport Internet graph you are connecting to the Transit router, so you can only view graphs for the A-End.
For information on how to view billing details for a connection, see VXC, Megaport Internet, and IX Billing.