Megaport Portal Dashboard
The Megaport Portal dashboard is an interactive experience that can show either a rotating globe or a flat projection. You can use the visualizations to see your Megaport defined network. You can also use it to add connections and services to your network.
Views
By default, you will see the interactive globe view. To change to the flat projection, click the flat map image on the right:

For more information, see Map controls on the right.
Map controls
There are control buttons on each side of the map. They provide information and a method to control what you see on the dashboard.
Tip
Hover the mouse over each control on the map to see its purpose.
Move the globe
To manipulate the globe view, click and drag on the globe.
- On a standard mouse, left-click and drag
- On an Apple magic mouse, click and drag
- On a tablet, touch and drag
Advanced globe view manipulation
You can use commands to completely invert the globe. This is useful if you want to view your network in a certain way, or to take screenshots of parts of your network that can only be seen this way.
To invert the globe view to north at the bottom
- With a standard mouse, drag sideways while holding the right button or drag sideways while holding ctrl and left button
- On a keyboard, click shift + left or right arrows
To restore the globe view to north at the top
- With a standard mouse, drag sideways while holding the right button or drag sideways while holding ctrl and left button
- On the keyboard, click shift + up arrow.
Map controls on the left
The controls on the left side of the map help you control how much information you see. Use the location filter buttons at the top of the left controls to choose which locations appear on the map.
| Control | Purpose |
|---|---|
 |
Show all locations. Displays all location types, including installed locations (Active and Deployment), extended locations, and locations where you have services. This is the default view. |
 |
Show installed locations. Displays only installed Megaport locations (Active and Deployment status) where you can order services directly. Occupied locations (locations where you have services) and extended locations are hidden. |
 |
Show extended locations. Displays only extended locations. Installed locations and locations where you have services are hidden. |
 |
Show locations where you have services. Displays only locations where you have deployed services, along with connection lines between them. Empty locations (where you have no services) are hidden. |
 |
Filter empty locations. See Locations for more information about empty locations. |
 |
Map key. This explains what the icons, colors, and links mean on the map, including the distinction between installed and extended locations. |
 |
Keyboard commands to control the map, including zoom and changing orientation. |
Search
The search function allows you to search the map for:
- Any service type. For example, VXC.
- A service name
- A product ID
- Megaport enabled locations but only if you do not have this turned off in your map settings
- Any place name in the world
Map controls on the right
The controls on the right side of the map control the screen mode (full-screen, large display, small display), the view (globe or flat map), and the level of zoom.
| Control | Purpose |
|---|---|
 |
Expand the map or globe to full screen. The Megaport Portal header and options are hidden. |
 |
Show the map or globe on the screen with the Megaport Portal full website in the view. This view will not show the Service status widgets. |
 |
Show the map or globe on the screen with the Megaport Portal full website in the view. This view will show the Service status widgets on the bottom of the screen. |
 |
Show the rotating globe view. |
 |
Show the flat map view. |
 |
Zoom in with large increments. |
 |
Zoom in with small increments. |
 |
Zoom out with small increments. |
 |
Zoom out with large increments. |
Service status widgets
The widgets at the bottom of the screen show the status of your configured services.
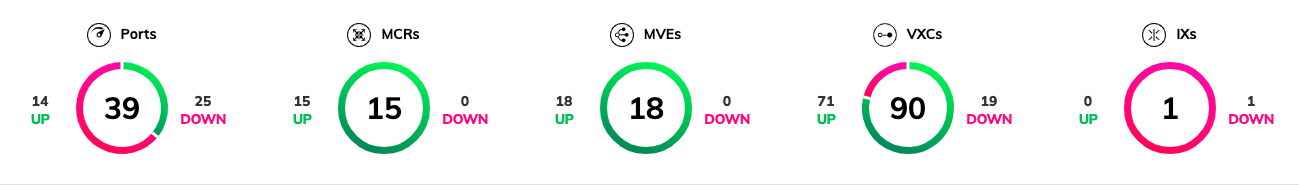
Each widget shows the number of configured Megaport network services, and the number that are up or down.
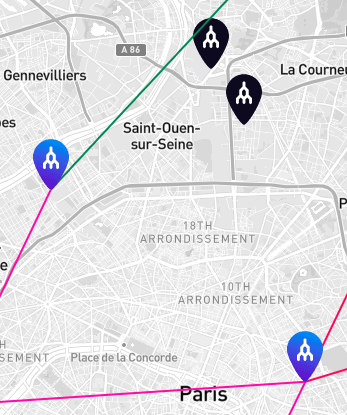
Locations
Each Megaport location is marked by a pin. The color of the pin indicates the location type and status:
| Pin | Status |
|---|---|
 |
Blue for occupied. An occupied location means that you have a Port or other network component at that location, or you have a connection that terminates on someone else’s Port or network component at that location. |
 |
Red for installed empty. An installed (empty) location means that Megaport hardware is available at that data center, but you do not currently have any services there. You can order services directly at these locations. |
 |
Black for extended empty. An extended location is a data center where Megaport hardware is not physically present, but services are available through a private connection from a nearby installed location. |
Tip
Use the location filter buttons on the left side of the map to show or hide specific location types. For more information, see Map controls on the left.
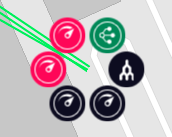
Location clusters
When you click a cluster of either occupied or empty locations, it will zoom in to show the next level of services expanded to show each service or location. The color of the icon shows the status of the service:
- Green for up and running
- Red for provisioned but not running
- Black for ports or connections that you do not own
There is also a location icon, which you can click to create services and get location details.
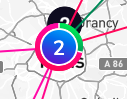
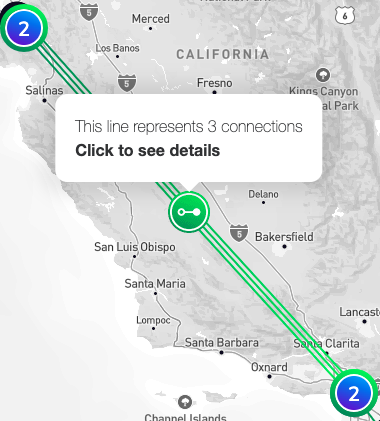
When you zoom out and the occupied locations are clustered, the number in the circle indicates the number of connections present in the clustered locations. The circle drawn around it shows the proportion of them that are up or down. The colors represent:
- Green for up
- Red for down
Location functions
When a location is expanded, you can click the location icon to see a pop-up with buttons that allow you to create available services or connections at that location.
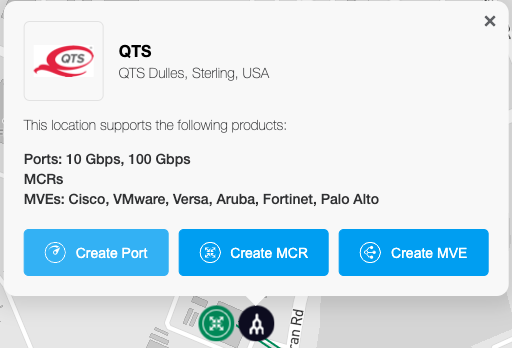
For more information about creating services, see Provision services.
Extended locations
Extended locations are data centers in the same campus or metro area as an installed Megaport location. Megaport hardware is not physically present at extended locations, but you can access services through a private cross connect from an installed location. You can order this cross connect to the Megaport installed location from your Data Center Operator at the extended location.
To view extended locations on the map, use the location filter buttons on the left side:
- Click the white pin button to show all locations, including extended locations alongside installed and occupied locations.
- Click the black pin button to show only extended locations and hide all other location types.
Extended locations appear with black pins on the map. When you click an extended location pin, the pop-up shows:
- The data center name, metro, and country
- A banner indicating that the location is extended via private connection from installed sites
- A list of installed (parent) sites that connect to the extended location
Note
To order services at an extended location, contact your Account Manager for assistance. Services are created from the installed (parent) locations, not directly at extended locations.
For more information about location types, see Understanding Locations.
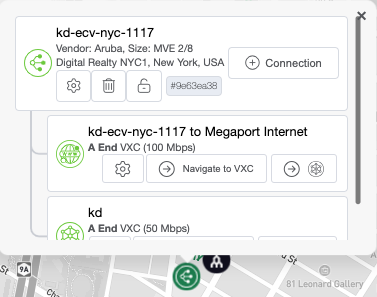
Component control
When you have focus on a location, you can keep clicking down to an individual service. You can use the map interface to see details, create, and remove services or connections. Click a service or connection icon to expand it and see the details.
See service details
Click an icon to see the details for that service.
Add network connections
You can add network connections from the Megaport Portal dashboard.
To add network connections
-
Click the Port or connection icon.
You will see a pop-up window that allows you to add a service.
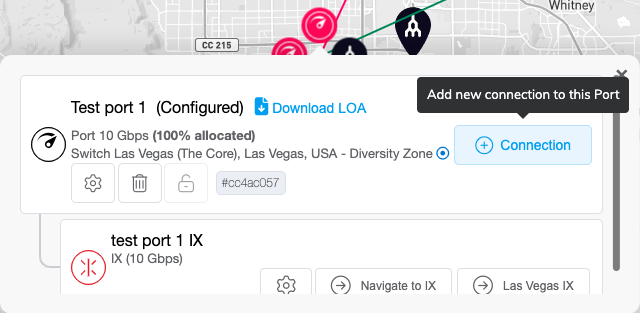
-
Click +Connection to open the New Connection page.
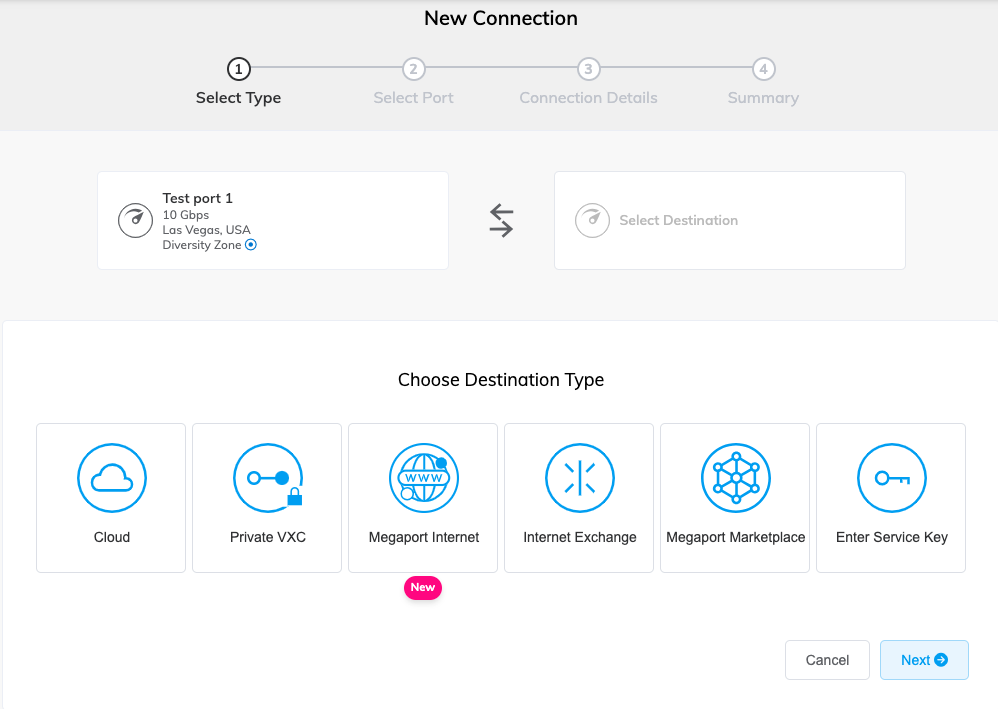
For more information about creating services, see Connections Overview.
Tip
The Megaport Portal saves where you were on the map if you head off to create or view services. When you finish that process, it takes you back to where you were. The Megaport Portal also saves your view of the map and will return you to the same zoom level so you see it as you last saw it.
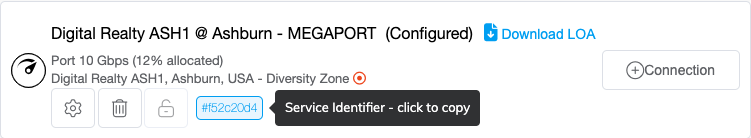
Update network connections
You can use the service pop-up to change settings or delete the service.
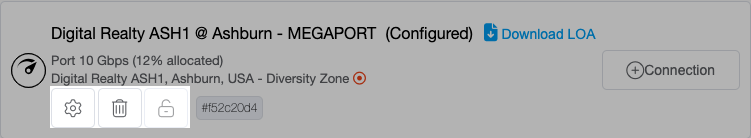
Click the button to copy the service identifier.
Connections
Connection lines can represent one or more connections between two locations. The color of the connection line indicates the status of the connection:
- Green for up
- Red for down
When you click a connection icon, the pop-up displays the ends according to their relative geographic location. This means that the button on the left will take you to the Port at the geographical left and the same for the right side.
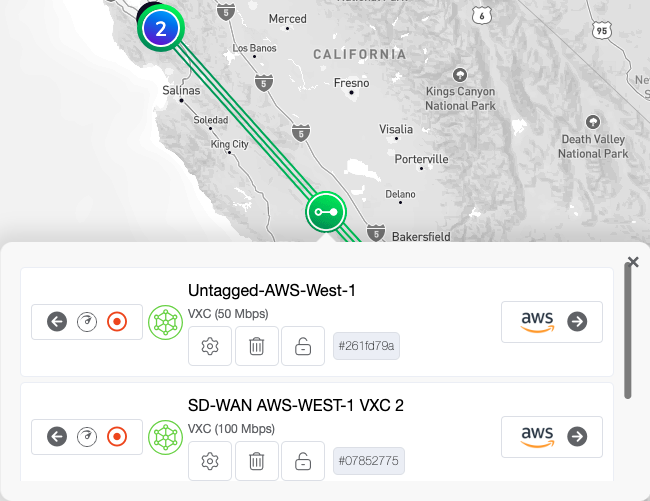
Click the A-End or B-End ports to go directly to that Port.